What's Up With Zero Average Time on Page in Google Analytics?

Here's one for the bloggers out there.
If you're serious about building a platform and an audience, you need to have Google Analytics installed on your blog. (Here's how).
From there, you need to be looking at how many people are visiting your site, where they're coming from, and, most importantly, how they're engaging with your content.
What are your most popular posts? Are people reading one post and then leaving? Are they spending the time to read your posts all the way through?
If, like me, you're looking at engagement metrics in Analytics for ideas on how your blog can be better, you've probably noticed something strange about the amount of time visitors are spending with your content. And if, like me, you're a bit of an Analytics newbie, you might be making some false assumptions based on misleading data.
In short, zero time on page or zero session duration in Google Analytics isn't accurate — it just means that a user left your site without triggering GA to hit "end" on their session timer, leaving them without an accurate measurment of how long the user was there.
So they just put "0:00"
But let's dive a little deeper.
The Problem
Does this chart look familiar from your blog's Analytics profile?
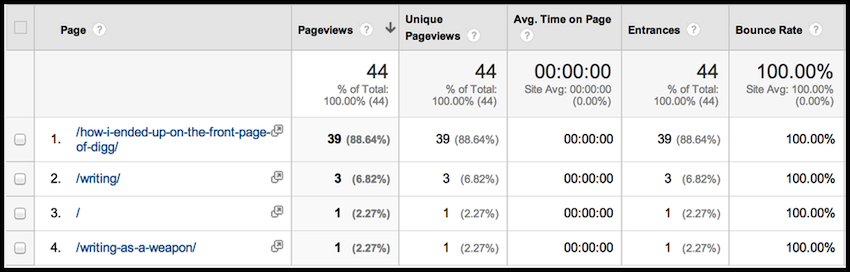
Note the column called "Avg. Time on Page". Note that it's showing Zero Seconds across the board.
Weird, right? I thought so, too.
Sometimes you're going to get low quality traffic. That's a given. It generally happens when a user winds up on your page even though the content on that page might not match their intent. A good example would be broad keyword matches in organic search -- someone searches Google for "writer" and somehow ends up here, for example. I hate to admit it, but in that case it's highly unlikely I am exactly what they were looking for. In a situation like that, that visitor will probably leave your site pretty quickly.
But zero-second Time on Page? People would have to be giving up on your site pretty damn fast.
It makes no sense.
The Explanation
Let's take a look at that chart again. But let's focus on a different column.
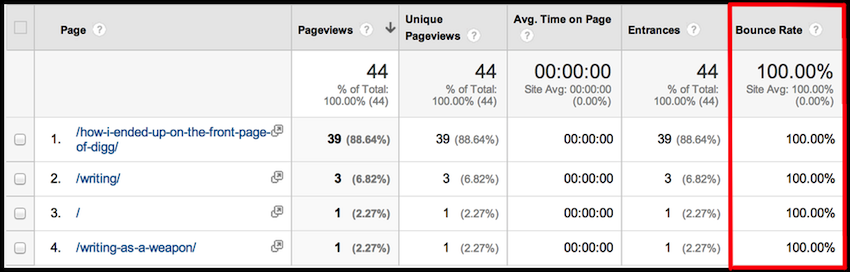
On this particular day, every single person who visited my site Bounced -- which means they visited only a single page and then left.
(Also check out: What's a good bounce rate for a blog?)
This is relevant because of the way Google Analytics calculates Time on Page.
When a visitor comes to your site, they are assigned a timestamp. So, Analytics might note that User Bob landed on your Homepage at 07:05:03. Then, Analytics assigns a new timestamp when that user accesses a new page on your site. So if Bob clicks on a link to your About page at 07:07:55, that leaves your Homepage with a Time on Page of 00:02:52.
Makes sense.
But what happens if Bob never accesses another page on your site? Or, in other words, if he Bounces?
Then there's no second timestamp for Google to work from. So they assign a Time on Page of 00:00:00.
But the problem goes beyond the Bounce.
Google needs two timestamps to measure Time on Page, right? In the previous example, Bob visited the Homepage, then moved to About, giving us two reference points. But what happens if he Exits your site after viewing the About page? He no longer qualifies as a Bounce (because he has viewed more than one page), but there will be no good data on how long he spent reading your fabulous biography.
From what I can tell, these zeroes don't count against your "Average Time on Page", assuming a mixture of Bounce and Non-Bounce visits (proof below... filtering out Bounce visits doesn't change the average):
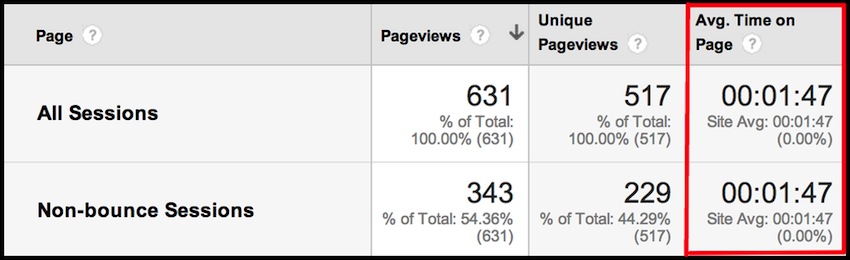
But this can still be jarring, as you saw in the example way at the beginning, when a page has 100% Bounce Rate or Exit %. If you're not careful, it can lead you to believe that people aren't engaging with your content at all, when actually, they might be.
The Solutions
So, this is annoying. And there are basically three things you can do about it.
Adjusted Bounce Rate
Google Analytics does offer a workaround known as Adjusted Bounce Rate, which executes an event after a user has spent a given amount of time on your page (you decide -- 10 seconds, 30 seconds, 5 minutes). If a user stays past that event, they no longer count as a bounce.
You can find instructions on how to implement Adjusted Bounce Rate here on the Google Analytics blog.
The problem is... this doesn't really solve your problem. Yes, you'll get fewer recorded bounces. And yes, you'll start to see more non-zero average times on page. But the data still won't be great.
If you set your Adjusted Bounce Rate for 30 seconds, say, and someone hangs around for 2 minutes before leaving, you're left with a view time of... 30 seconds.
Not ideal.
Analytics Hacks
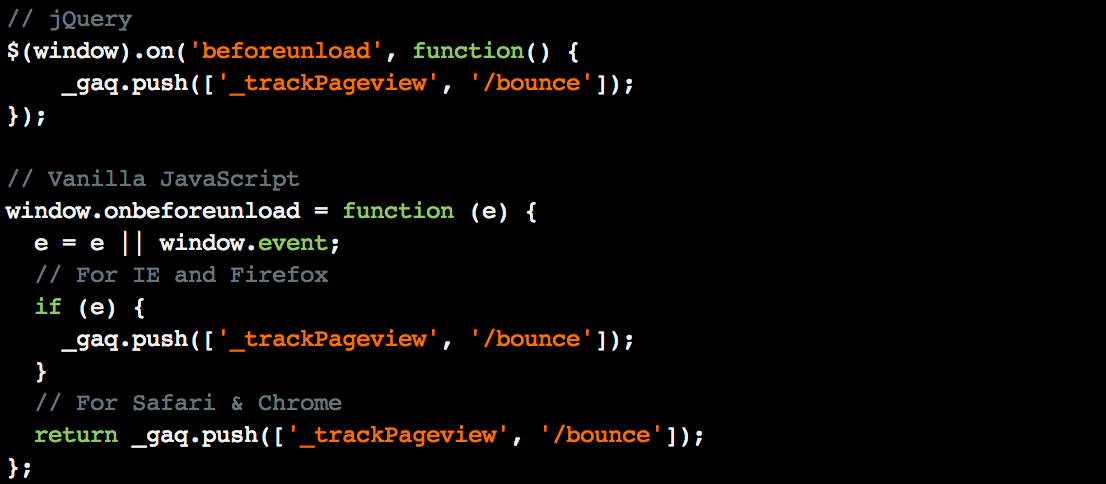
If the official solution isn't good enough, take comfort in knowing that enterprising people in the digital community have concocted all kinds of workarounds for this problem. Below is one courtesy of Particulate Tech Blog -- it's a piece of code you can add to your site to force a "dummy" pageview as the user exits or closes out of your site.
I haven't used this myself, so I can't vouch for it, but in theory it would solve the problem by giving Analytics the second timestamp it needs.
You can also search code communities like StackOverflow for other solutions if you're willing to get your hands dirty. And if you really want that data.
Reduce Bounce Rate & Exit %
For any page on your site, the Bounce Rate reflects how often this was the only page visited by a user. The Exit % reflects how often this was the last page visited by the user.
Both can cause Analytics to record zero Time on Page data.
When you're combing through your site metrics, the best thing you can do is be wary of the problem. Look at Bounces and Exits -- if they're really high on a given page, you should know that you probably aren't working with great information.
Try to improve these numbers across the board. Yes -- visitors will have to Exit your site somewhere, but if everyone's coming in, viewing one page, and then leaving, figuring out their level of engagement is going to be a huge headache.
Some basic ideas to keep people engaging with more of your content:
- Add Related Articles at the end of your posts
- Interlink your posts often (but only where relevant!)
- Have Categories, Popular Posts, and other sortables visible at all times
- Add a Call to Action at the end of posts/pages -- contact me, read about me, etc.
Why is Time on Page Important?
This whole post was a really long-winded way of saying, "Google Analytics has flaws in how it records Time on Page. You can be aware of it, but there's not much you can really do unless you like tinkering with raw Analytics code and producing dummy pageviews."
So why go through all of this trouble?
Because Time on Page is an important and useful metric for writers and bloggers.
Imagine this. You have a post you know should take a few minutes to read, but the Average Time on Page is way under that. 50 seconds, perhaps. Maybe even less.
That should tell you something.
Maybe your intro is too longwinded. Maybe you need some images to add visual interest. Maybe your headline isn't getting people excited to read. Or maybe, once people click through to that page, they realize it isn't what they expected, so they leave.
These are all things you can tweak. But in order to tweak, you have to know what's not working.
For that reason, it's worth knowing when you can and can't trust Time on Page.
Further Reading
- Standard Metrics Revisited: Time on Page & Time on Site
- The Limitations of Avg Time on Page & Avg Time on Site
Member discussion